
A companion function Sankey Widget that produces data compatible with the widget. For more information about Sankey widgets, see Sankey Diagram Widget.
| Parameter | Type | Required | Default Value | Description |
|---|---|---|---|---|
source | string | required | The field containing the source node ID. | |
target | string | required | The field containing the target node ID. | |
weight | aggregate | optional[a] | count(as=_count) | A function used to calculate the weight the edges. Good candidates are functions like, for example, sum(), count() or max(). |
[a] Optional parameters use their default value unless explicitly set. | ||||
sankey()Examples
Click next to an example below to get the full details.
Create Data Compatible With Sankey Diagram Widget - Example 1
Create data compatible with sankey diagram widget using the
sankey() function to show flow relationship
Query
type=accesslog
| sankey(source=method, target=url)
Introduction
In this example, the sankey() function is
used to produce sankey compatible data for a webserver log showing
wich URLs matches the HTTP methods.
Example incoming event data might look like this:
| type | timestamp | method | url |
|---|---|---|---|
| accesslog | 2025-05-02 11:45:23 | GET | /api/users |
| accesslog | 2025-05-02 11:45:30 | POST | /api/users |
| accesslog | 2025-05-02 11:46:12 | GET | /api/products |
| accesslog | 2025-05-02 11:46:45 | PUT | /api/users |
| accesslog | 2025-05-02 11:47:01 | DELETE | /api/users |
| accesslog | 2025-05-02 11:47:33 | GET | /api/orders |
| accesslog | 2025-05-02 11:48:02 | POST | /api/orders |
| accesslog | 2025-05-02 11:48:15 | GET | /api/cart |
| accesslog | 2025-05-02 11:48:45 | POST | /api/login |
| accesslog | 2025-05-02 11:49:01 | GET | /api/logout |
| accesslog | 2025-05-02 11:49:30 | GET | /api/users |
| accesslog | 2025-05-02 11:50:00 | POST | /api/products |
| accesslog | 2025-05-02 11:50:23 | PUT | /api/products |
| accesslog | 2025-05-02 11:50:45 | GET | /api/users |
| accesslog | 2025-05-02 11:51:12 | POST | /api/cart |
| accesslog | 2025-05-02 11:51:33 | GET | /api/users |
| accesslog | 2025-05-02 11:52:01 | GET | /api/products |
| accesslog | 2025-05-02 11:52:30 | POST | /api/orders |
| accesslog | 2025-05-02 11:53:00 | DELETE | /api/products |
| accesslog | 2025-05-02 11:53:15 | GET | /api/dashboard |
Step-by-Step
Starting with the source repository events.
- logscale
type=accesslogFilters for all webserver logs. The access log is a list of all requests for individual files (for example HTML files) that users have made from a website, therefore, webserver logs provide valuable business insight.
- logscale
| sankey(source=method, target=url)Produces sankey compatible data for a webserver log showing wich URLs matches the HTTP methods. It shows how traffic is distributed across different endpoints.
Note that source and target are required fields to be able to produce a Sankey Diagram.
Event Result set.
Summary and Results
The query is used to produce data compatible with sankey diagram widgets, in this example visualizing the relationship between HTTP methods and URLs.
Sankey diagram widgets are a powerful data visualization tool used to represent the flow of values between stages, offering valuable insights into the flow of data. When used with well-structured data, they can help identify patterns, bottlenecks, and significant resource allocation trends.
Sankey diagram widgets are useful in case you want to show complex processes visually, with a focus on a single aspect or resource required to be highlighted. Sankey diagram widgets can also be used to reveal inconsistent data, as the visualization of data inconsistencies makes detection easier.
 |
Create Data Compatible With Sankey Diagram Widget - Example 2
Create data compatible with sankey diagram widget using the
sankey() function to show flow relationship
Query
Type=accesslog referrer!="-"
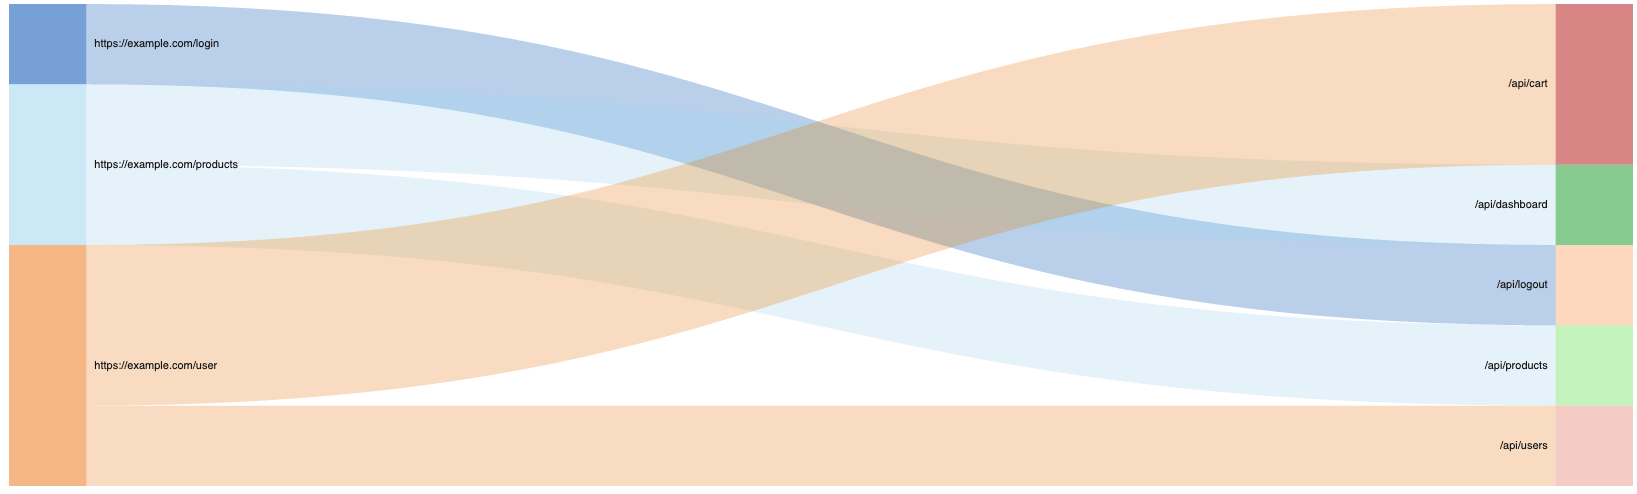
| sankey(source=referrer, target=url)Introduction
In this example, the sankey() function is
used to produce sankey compatible data for a webserver log showing
the URL address (the referrer) of the website that sends users to
another website using a link.
| Type | timestamp | method | url | referrer |
|---|---|---|---|---|
| accesslog | 2025-05-02 11:45:23 | GET | /api/users | - |
| accesslog | 2025-05-02 11:45:30 | POST | /api/users | - |
| accesslog | 2025-05-02 11:46:12 | GET | /api/products | - |
| accesslog | 2025-05-02 11:46:45 | PUT | /api/users | - |
| accesslog | 2025-05-02 11:47:01 | DELETE | /api/users | https://example.com/user |
| accesslog | 2025-05-02 11:47:33 | GET | /api/orders | - |
| accesslog | 2025-05-02 11:48:02 | POST | /api/orders | - |
| accesslog | 2025-05-02 11:48:15 | GET | /api/cart | https://example.com/user |
| accesslog | 2025-05-02 11:48:45 | POST | /api/login | - |
| accesslog | 2025-05-02 11:49:01 | GET | /api/logout | https://example.com/login |
| accesslog | 2025-05-02 11:49:30 | GET | /api/users | - |
| accesslog | 2025-05-02 11:50:00 | POST | /api/products | - |
| accesslog | 2025-05-02 11:50:23 | PUT | /api/products | - |
| accesslog | 2025-05-02 11:50:45 | GET | /api/users | - |
| accesslog | 2025-05-02 11:51:12 | POST | /api/cart | https://example.com/user |
| accesslog | 2025-05-02 11:51:33 | GET | /api/users | - |
| accesslog | 2025-05-02 11:52:01 | GET | /api/products | - |
| accesslog | 2025-05-02 11:52:30 | POST | /api/orders | - |
| accesslog | 2025-05-02 11:53:00 | DELETE | /api/products | https://example.com/products |
| accesslog | 2025-05-02 11:53:15 | GET | /api/dashboard | https://example.com/products |
Step-by-Step
Starting with the source repository events.
- logscale
Type=accesslog referrer!="-"Filters for all webserver logs where the referrer is not equal to
-. It returns all results where the value is not-.The value
-is often used by analytics to define an empty value. In this example, we therefore filter for webserver logs where there is referrer information. - logscale
| sankey(source=referrer, target=url)Produces sankey compatible data for a webserver log showing wich target URLs matches the referrer URL. If one URL links to the same website twice, the count of referring pages for that website will be one and the count of backlinks will be two.
Note that source and target are required fields to be able to produce a Sankey Diagram.
Event Result set.
Summary and Results
The query is used to produce data compatible with sankey diagram widgets, showing the referrer URL. The query is useful to get an overview of the webpage that a user was on right before they landed on your page, the target (it shows how users navigate to different URLs on your site).
 |
Create Sankey Diagram Calculating Edge Thickness
Create a Sankey diagram calculating the edge thickness using the
sankey() function with an aggregator
Query
sankey(source="src", target="dst", weight=(sum(cnt)))Introduction
In this example, the sankey() function is used with
the weight parameter to show
the edge thickness of the fields
cnt (count),
dst (destination), and
src (source) in a Sankey
diagram. Edge thickness in a Sankey diagram represents the magnitude or
quantity of flow between nodes.
The edge is the connecting line between source and
target nodes, and the thickness represents the
weightend value of that connection.
Example incoming data might look like this:
| cnt | dst | src |
|---|---|---|
| 12 | apples | john |
| 1 | bananas | john |
| 1 | apples | joe |
| 1 | apples | sarah |
| 1 | apples | sarah |
| 1 | apples | sarah |
Step-by-Step
Starting with the source repository events.
- logscale
sankey(source="src", target="dst", weight=(sum(cnt)))Creates a Sankey diagram showing the sources on the left side (john, joe, sarah), and the targets on the right side (apples, bananas), and then provides the edge thickness based on the sum.
Event Result set.
Summary and Results
The query is used to create a Sankey diagram showing the sources on the
left side (john, joe, sarah), and the targets on the right side (apples,
bananas), and then display the edge thickness using the
weight parameter. In this
example, the thickest edge is john → apples
(12), the medium edge is sarah → apples
(3), and the thin edges are joe → apples
(1) and john → bananas (1).
The query is useful for rendering results as a two-level Sankey diagram and visualize flow relationships between nodes. It shows proportional relationships between data categories.
Sample output from the incoming example data:
| source | target | weight |
|---|---|---|
| joe | apples | 1 |
| john | apples | 12 |
| john | bananas | 1 |
| sarah | apples | 3 |
 |